Le risposte alle richieste del controllo Web ADF possono essere processate tramite l'evento requestProcessed lato client.
Si può rendere disponibile questa funzionalità semplicente aggiungendo un PostbackManager alla pagina.
Per i dettagli vedere qui.
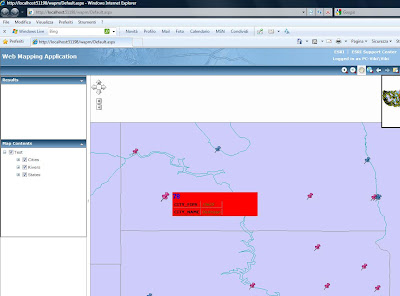
Nel MapResourceManager definiamo un layer di tipo GraphicLayer nominandolo 'Client Rendered Graphics' ed uno di tipo ArcGIS Server Internet da http://sampleserver1.arcgisonline.com/ArcGIS/services ( Specialty/ESRI_StatesCitiesRivers_USA ). Al di sotto di una certa scala (nell'esempio a 7.000.000) visualizziamo le città con delle icone in funzione della popolazione del 1990 (>32000 abitanti icone blu altrimenti magenta) con un mapTip formattato lato client e dove è possibile, ad esempio, gestire in base a determinate condizioni.
Lato server:
public partial class _Default : System.Web.UI.Page
{private bool _hasNonPooledResources = false;
#region Page Methodsprotected void Page_Load(object sender, EventArgs e)
{ if (!Page.IsPostBack) {if (Map1.MapResourceManager == null || Map1.MapResourceManager.Length == 0)
callErrorPage("No Map Resource Manager defined for the Map.", null);
if (MapResourceManager1.ResourceItems.Count == 0)callErrorPage("The Map Resource Manager does not have a valid Resouce Item.", null);
if (Map1.PrimaryMapResourceInstance == null)
callErrorPage("The Map does not have a valid Primary Map Resource.", null);
}
// Check for locale decimal delimiter and pass to client sidestring delimiterScript = "var webMapAppDecimalDelimiter = '" + GetDecimalSeparatorFromLocale() + "';";
if (!Page.ClientScript.IsClientScriptBlockRegistered("decimalDelimiterScript"))
Page.ClientScript.RegisterClientScriptBlock(Page.GetType(), "decimalDelimiterScript", delimiterScript, true);
PostbackManager1.RequestReceived += new RequestReceivedEventHandler(PostbackManager1_RequestReceived);
}
void PostbackManager1_RequestReceived(object sender, AdfRequestEventArgs args)
{ // Make sure request was issued by PostbackManagerif (args.CallingControl.ClientID == "PostbackManager1")
{ NameValueCollection requestArgs = CallbackUtility.ParseStringIntoNameValueCollection(args.RequestArguments);if (requestArgs["EventArg"] == "Type") // Request for client-rendered county graphic (i.e. map tip)
{IMapFunctionality mapFunctionality = Map1.GetFunctionality("Test");
IMapFunctionality mapFunctionality1 = Map1.GetFunctionality("Client Rendered Graphics");
ESRI.ArcGIS.ADF.Web.DataSources.Graphics.MapResource mapResource =mapFunctionality1.Resource as ESRI.ArcGIS.ADF.Web.DataSources.Graphics.MapResource;
if (Map1.Scale > 7000000.0) {mapResource.Graphics.Clear();
Map1.RefreshResource("Client Rendered Graphics");PostbackManager1.CallbackResults.CopyFrom(Map1.CallbackResults);
return;}
// Create functionality to query Operational resource IGISResource gisResource = mapFunctionality.Resource; IQueryFunctionality queryFunctionality =gisResource.CreateFunctionality(typeof(IQueryFunctionality), null) as
IQueryFunctionality;NumberFormatInfo nfi = new CultureInfo("en-US").NumberFormat;
double x1 = double.Parse(requestArgs["XMIN"],nfi);
double y1 = double.Parse(requestArgs["YMIN"],nfi);
double x2 = double.Parse(requestArgs["XMAX"], nfi);
double y2 = double.Parse(requestArgs["YMAX"], nfi);
// Create spatial query filter ESRI.ArcGIS.ADF.Web.SpatialFilter spatialFilter =new ESRI.ArcGIS.ADF.Web.SpatialFilter();
spatialFilter.SubFields = new ESRI.ArcGIS.ADF.StringCollection(
new string[] { "FID", "CITY_FIPS", "CITY_NAME", "POP1990" });
spatialFilter.ReturnADFGeometries = true;spatialFilter.Geometry = new ESRI.ArcGIS.ADF.Web.Geometry.Envelope(x1,y1,x2,y2);
// Execute query against counties layer DataTable resultsDataTable = queryFunctionality.Query(mapFunctionality.Name, "0", spatialFilter); // Create graphics and apply Operational resource's layer definitions GraphicsLayer resultsGraphicsLayer = ESRI.ArcGIS.ADF.Web.Converter.ToGraphicsLayer(resultsDataTable,System.Drawing.Color.Empty, System.Drawing.Color.Empty,
System.Drawing.Color.Empty, true);
resultsGraphicsLayer.TableName = "find_Cities"; // Render on client to enable highlighting and MapTips resultsGraphicsLayer.RenderOnClient = true; // Add tipo to Graphics resourceif (mapResource.Graphics.Tables.Contains("find_Cities"))
mapResource.Graphics.Tables.Remove("find_Cities");mapResource.Graphics.Tables.Add(resultsGraphicsLayer);
// Refresh the graphics and pass the results to the PostbackManager Map1.RefreshResource("Client Rendered Graphics"); // Use the CustomResults property to pass the client ID of the graphics layer back to the // client. This property is used in the processResults function. if (resultsGraphicsLayer.Rows.Count > 0) {PostbackManager1.CustomResults = Map1.GetGraphicsLayerClientID(resultsGraphicsLayer);
}
}
PostbackManager1.CallbackResults.CopyFrom(Map1.CallbackResults);
}
}
Lato client:
<script language="javascript" type="text/javascript">
Sys.Application.add_init(function() {// Get map and wire MapTips events
var map = $find('Map1');map.add_extentChanged(MapChanged);
// Specify handler for requestProcessed
ESRI.ADF.Samples.PostbackManager.add_requestProcessed(processResults);
});
function MapChanged(sender, eventArgs){var requestArgs = 'EventArg=Type&XMIN={0}&YMIN={1}&XMAX={2}&YMAX={3}';
var envelope = eventArgs.current;
requestArgs = String.format(requestArgs, envelope.get_xmin(),envelope.get_ymin(),envelope.get_xmax(),envelope.get_ymax());
ESRI.ADF.Samples.PostbackManager.doAsyncRequest(requestArgs);
}
// Handle results to show map tip and disable subsequent requests
function processResults(sender, eventArgs) { if (eventArgs.customResults) { if (eventArgs.customResults == "Clear") {return;
}
var graphicFeatureGroup = $find(eventArgs.customResults);
var defaultSymbol11 = new ESRI.ADF.Graphics.MarkerSymbol('images/pin-blue-20x20.png', 10, 10, 'default'); var defaultSymbol12 = new ESRI.ADF.Graphics.MarkerSymbol('images/pin-blue-28x28.png', 14, 14, 'default');defaultSymbol11.set_opacity(0.8);
defaultSymbol11.set_height(20);
defaultSymbol12.set_opacity(0.8);
defaultSymbol12.set_height(28);
var defaultSymbol21 = new ESRI.ADF.Graphics.MarkerSymbol('images/pin-magenta-20x20.png', 10, 10, 'default'); var defaultSymbol22 = new ESRI.ADF.Graphics.MarkerSymbol('images/pin-magenta-28x28.png', 14, 14, 'default');defaultSymbol21.set_opacity(0.8);
defaultSymbol21.set_height(20);
defaultSymbol22.set_opacity(0.8);
defaultSymbol22.set_height(28);
for (var i=0;i<graphicFeatureGroup.getFeatureCount();i++)
{var graphicFeature = graphicFeatureGroup.get(i);
if (graphicFeature.get_attributes().POP1990 > 32000.0)
{graphicFeature.set_selectedSymbol(defaultSymbol11);
graphicFeature.set_highlightSymbol(defaultSymbol12);
}
else
{graphicFeature.set_selectedSymbol(defaultSymbol21);
graphicFeature.set_highlightSymbol(defaultSymbol22);
}
}
var layout = {'template': null,
'templateUrl': 'Template.htm',
'arrowUrl': 'images/square-red-32x32.png',
'arrowBounds': [
// startX,startY,width,height,offsetX,offsetY,bufferX,bufferY
[954, 921, 16, 16, -1, -7, 5, -7], // NW - Upper Left
[939, 921, 16, 16, -15, -7, 5, -7], // NE - Upper Right
[954, 921, 16, 16, -1, -23, 5, -7], // SW - Lower Left
[939, 921, 16, 16, -15, -23, 5, -7] // SE - Lower Right
]
};
var mapTips = graphicFeatureGroup.get_mapTips();
//mapTips.set_width(100); //set larghezza
mapTips.set_layout(layout);
// Initialize a string containing the format for the MapTips title. The appearance can be
// specified using HTML and CSS. Field names surrounded with curly braces and preceded with
// an @ are substituted at run-time with the corresponding field value of the feature on which
// a MapTip is currently shown. In this example, the AREANAME field is shown.
var titleTemplate = "<font style='font-family:MS Sans Serif; color:blue; font-size:14pt;'>{@FID}</font>";
// Initialize a string containing the format for the MapTips contents.
var contentTemplate = "<table cellpadding='3px'>
<tr>
" +
"<td style='border-bottom:1px solid gray; border-right:1px solid gray; font-weight:bold;'>
" +
"CITY_FIPS
</td>" +
"<td style='border-bottom:1px solid gray; border-right:1px solid gray; font-style:italic; " +
"color:green;'>{@CITY_FIPS}</td>
</tr>" +
"<tr>
<td style='border-bottom:1px solid gray; border-right:1px solid gray; font-weight:bold;'>
" +
"CITY_NAME
</td>" +
"<td style='border-bottom:1px solid gray; border-right:1px solid gray; font-style:italic;" +
"color:green;'>{@CITY_NAME}</td>
</tr>
</table>";
// Apply the title and content formats
mapTips.set_hoverTemplate(titleTemplate);
mapTips.set_contentTemplate(contentTemplate);
}
}
</script>

Scarica qui la soluzione


Nessun commento:
Posta un commento