-----------------------------------

Acquista i software ArcGIS tramite Studio A&T srl, rivenditore autorizzato dei prodotti Esri.

I migliori software GIS, il miglior supporto tecnico!

I migliori software GIS, il miglior supporto tecnico!
Azienda operante nel settore GIS dal 2001, specializzata nell’utilizzo della tecnologia ArcGIS e aderente ai programmi Esri Italia Business Network ed Esri Partner Network

-----------------------------------


Visualizzazione post con etichetta ArcGIS API Silverlight. Mostra tutti i post

sabato 13 febbraio 2010

Sql server 2008: SQL Server Geospatial Services WMS

Volevo segnalarvi un interessante progetto in corso su codeplex per esporre i dati sql server in servizi wms, wfs, wps, geojson e tile.

In questo post ho provato ad utilizzare il servizio WMS esposto da SQL server 2008 con un client Silverlight servendomi  dell'esempio ESRI di Silverlight (esempio di subclassing della classe astratta DynamicMapServiceLayer).

Comunque, per queste due soluzioni, ho dovuto fare alcune piccole correzioni riguardo alla gestione del simbolo di separatore decimale in base alla cultura. Se avete le impostazioni internazionali sull'Inglese, potete tranquillamente utilizzare le versioni originali.

Da Visual Studio 2008 aprite il progetto OgcWebServices e poi includete l'altro progetto (GeoSpatialServices). Da Solution Explorer visualizzate i file nascosti (Show Hidden Files) e in App_Data fate doppio click sul file TestGeospatialServicesDatabase.mdf (in questo modo fate un attach del file in sql server 2008 express). A questo punto, sempre in App_Data, aprite il file WFSConfiguration.xml e modificate la vostra connessione al database.


Una volta compilata ed eseguita la soluzione, visualizzerete una pagina con dei link di test:
il secondo link visualizza l'intero layer con un SLD di default


il terzo link visualizza l'intero layer con un SLD specifico (SLD di nome region)


Ora lasciamo attivo il progetto, in modo che sia in grado di ricevere le chiamate, ed apriamo il progetto wms (cioè l'esempio di ESRI); poi compiliamo ed eseguiamo la soluzione


Se non specificate lo style nello XAML dovreste vedere il vostro layer sovrapposto allo StreetMap World 2D di ESRI.


se, in caso contrario, specificate l'SLD:

<esriWMS:WMSMapServiceLayer ID="AGSWMSLayer"
                     Url="http://localhost:49241/service.wms"                    
                     SkipGetCapabilities="False"
                     Layers="world_admin" Version="1.3.0" Opacity="0.7" Styles="region"/>

dovreste vedere:


Scarica qui la soluzione

martedì 13 ottobre 2009

Geocoding & StreetView Google per ESRI API Silverlight

Pagine aspx dell'applicazione web

<%@ Page="" Language="C#" AutoEventWireup="true" %>
<%@ Register="" Assembly="System.Web.Silverlight" Namespace="System.Web.UI.SilverlightControls"
TagPrefix="asp" %>
<!DOCTYPE html PUBLIC "-//W3C//DTD XHTML 1.0 Transitional//EN" "http://www.w3.org/TR/xhtml1/DTD/xhtml1-transitional.dtd">
<script src="http://maps.google.com/maps?file=api&amp;v=2&amp;key=YourKey" type="text/javascript"></script>
<script src="http://jqueryjs.googlecode.com/files/jquery-1.3.2.min.js" type="text/javascript"></script>
<script src="http://ui.jquery.com/latest/ui/effects.core.js" type="text/javascript"></script>
<script src="http://ui.jquery.com/latest/ui/effects.explode.js" type="text/javascript"></script>
<script src="http://ui.jquery.com/latest/ui/ui.core.js" type="text/javascript"></script>
<script src="http://ui.jquery.com/latest/ui/ui.draggable.js" type="text/javascript"></script>
<html xmlns="http://www.w3.org/1999/xhtml" style="height:100%;">
<head runat="server">
<title>Silverlight Google Geocode/StreetView</title>
<script type="text/javascript">
$(document).ready(function() {
$('#txtAddress').keypress(function(e) {
if (e.which == 13) {
$('#btnFindAddress').click();
e.preventDefault();
}
});
});
function runEffect(x,y,divID) {
//run the effect
$("#" + divID).css({ left: x, top: y });
$("#" + divID).effect('bounce');
//set draggable
$("#" + divID).draggable({ cursor: 'crosshair'});
$("#" + divID).draggable('disable');
};
var geocoder;
function FindAddress(address) {
geocoder = new GClientGeocoder();
geocoder.getLocations(address, addAddressToMap);
}
function addAddressToMap(response) {
if (!response response.Status.code != 200) {
alert("No Address found");
} else {
place = response.Placemark[0];
var lon = place.Point.coordinates[0];
var lat = place.Point.coordinates[1];
var address = place.address;
slControl.Content.slApplication.FindIndirizzo(lon, lat, address);
}
}
function streetView(lat, lon, x, y, divID) {
//alert("Message received from Silverlight:" + divID);
var latlng = new GLatLng(lat, lon);
var svp = new GStreetviewClient();
svp.getNearestPanoramaLatLng(latlng,
function(newPoint) {
if (newPoint == null) {
alert("Street View Not Available For This Location");
return;
}
var divMain = document.createElement('div');
divMain.setAttribute("id", divID + "_Contain");
divMain.setAttribute("style", "position:absolute; z-index:1000; height: 325px; width: 300px;background-color:#888888");
var btnDraggable = document.createElement('input');
btnDraggable.setAttribute("id", divID + "_Move");
btnDraggable.setAttribute("type", "button");
btnDraggable.setAttribute("style", "position:relative;z-index:1000;height: 25px; width: 60px;left:5px;top:5px");
btnDraggable.setAttribute("value", "unlock");
btnDraggable.setAttribute("onclick", "var a = $get('" + divID + "_Move');var b = $('#" + divID + "_Contain');if (a.value =='unlock') {a.value = 'lock'; b.draggable('enable');}else{a.value = 'unlock';b.draggable('disable');}");
divMain.appendChild(btnDraggable);
var btnClose = document.createElement('input');
btnClose.setAttribute("id", divID + "_Close");
btnClose.setAttribute("type", "button");
btnClose.setAttribute("style", "position:relative;z-index:1000;height: 25px; width: 60px;left:180px;top:5px");
btnClose.setAttribute("value", "close");
btnClose.setAttribute("onclick", "var a = $get('" + divID + "_Contain');a.style.display='none';");
divMain.appendChild(btnClose);
var divSV = document.createElement('div');
divSV.setAttribute("id", divID);
divSV.setAttribute("style", "position:relative;z-index:1000;height: 290px; width: 290px;left:5px;top:5px");
divMain.appendChild(divSV);
document.forms[0].insertBefore(divMain, $get("controlSL"));
panoramaOptions = { latlng: newPoint };
svp = new GStreetviewPanorama(divSV);
GEvent.addListener(svp, "error", StreetViewError);
var myPov = { yaw: 176.03773913343627, pitch: -0.13590989423507835 };
svp.setLocationAndPOV(latlng, myPov);
runEffect(x, y, divID + "_Contain");
});
}
function StreetViewError(errorCode) {
if (errorCode == 603) {
alert("Error: Flash doesn't appear to be supported by your browser");
return;
}
if (errorCode == 600) {
alert("Street View Not Available For This Location");
return;
}
}
var slControl = null;
function pluginLoaded(sender){
slControl = sender.get_element();
};
</script>
</head>
<body style="height:100%;margin:0;">
<form id="form1" runat="server" style="height:100%;">
<asp:ScriptManager ID="ScriptManager1" runat="server"></asp:ScriptManager>
<div id ="controlSL" style="height:100%;">
<asp:Silverlight ID="Xaml1" runat="server" Source="~/ClientBin/saGoogleGeocode.xap" Windowless ="true" OnPluginLoaded="pluginLoaded" MinimumVersion="2.0.31005.0" Width="100%" Height="97%" />
<input id="txtAddress" type="text" />
<input id="btnFindAddress" type="button" value="Find address (Google)" onclick="FindAddress($get('txtAddress').value);" />
</div>
</form>
</body>
</html>


Page.xaml


using System;
using System.Windows.Browser;
using System.Windows.Controls;
using ESRI.ArcGIS.Client;
using ESRI.ArcGIS.Client.Geometry;
//Domenico Ciavarella www.studioat.it
namespace saGoogleGeocode
{
public partial class Page : UserControl
{
public Page()
{
InitializeComponent();
}
[ScriptableMember()]
public void FindIndirizzo(double lon, double lat, string address)
{
Graphic graphic = new Graphic();
graphic.Symbol = StrobeMarkerSymbol;
graphic.Attributes.Add("Address", address);
MapPoint pt = new MapPoint(lon, lat,new SpatialReference(4326));
graphic.Geometry = pt;
GraphicsLayer graphicsLayer = MyMap.Layers["MyGraphicsLayer"] as GraphicsLayer;
graphicsLayer.ClearGraphics();
graphicsLayer.Graphics.Add(graphic);
MyMap.ZoomTo(pt.Envelope(0.005));
//if you project point
//GeometryService geometryService = new GeometryService("http://sampleserver1.arcgisonline.com/ArcGIS/rest/services/Geometry/GeometryServer");
//geometryService.ProjectCompleted += GeometryService_ProjectCompleted;
//graphic.Geometry = new MapPoint(lon, lat, new SpatialReference(4326));
//IList<Graphic> graphics = new List<Graphic>() { graphic };
//geometryService.ProjectAsync(graphics, new SpatialReference(3003)); //<---your wkid
}
private void MyMap_MouseClick(object sender, Map.MouseEventArgs e)
{
MapPoint p = e.MapPoint;
string divId = Guid.NewGuid().ToString();
HtmlPage.Window.Invoke("streetView", p.Y, p.X, e.ScreenPoint.X, e.ScreenPoint.Y,divId);
}
}
public static class Utility
{
public static Envelope Envelope(this MapPoint pt, double expand)
{
return new Envelope(pt.X - expand, pt.Y - expand, pt.X + expand, pt.Y + expand);
}
}
}


Scarica qui la soluzione

giovedì 30 luglio 2009

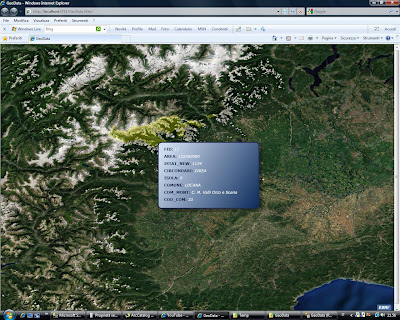
SQL Server 2008 Layer

This is an example of how to visualize spatial data stored in SQL Server 2008 (and Express) using Silverlight ESRI API. In a nutshell, we create a WCF service acting as a connection to database SQL Server which reads spatial data in a table with a geography field and converts SQL geography format into geometry ESRI.
In WFC service, in the reference we use the WPF Silverlight ESRI API library containing the definition of geometry class which can be used with the same contract as far as the silverlight client part is concerned.
Calling the WFC Service from client silverlight allows you to catch objects (including geometry ESRI) to be visualized on the map.
With this code you can load points, lines and polygons but geography not valid data have not still been checked.

From sqlgeography to geometry ESRI:


public static Geometry CreateGeography(SqlGeography geometry)

        {


            string geometryType = geometry.STGeometryType().Value;


            if (string.Compare(geometryType, "Point") == 0)

                return geometry.GetPointN(1);

            else if (string.Compare(geometryType, "MultiPoint") == 0)

            {

                MultiPoint multipoint = new MultiPoint();

                geometry.PopulatePointCollection(multipoint.Points);

                return multipoint;

            }

            else if ((string.Compare(geometryType, "Polygon") == 0) || (string.Compare(geometryType, "MultiPolygon") == 0))

            {

                return geometry.BuildPoly<Polygon>((Polygon p, PointCollection t1) => p.Rings.Add(t1));

            }

            else if ((string.Compare(geometryType, "LineString") == 0) || (string.Compare(geometryType, "MultiLineString") == 0))

            {

                return geometry.BuildPoly<Polyline>((Polyline p, PointCollection t1) => p.Paths.Add(t1));

            }           

            return null;

        }


In order to visualize your own data, in the WFC Service insert your connection string to database.


public System.Collections.Generic.List<Feature> GetSpatialData(Query query)

        {

            try

            {


                ///////////////////////////////////////////////////////////////////////////////////////////////////////////

                string connString = @"Data Source=PC-HOME\SQLEXPRESS;Initial Catalog=SpatialData;Integrated Security=True";

                //For instance @"Data Source=MyServerName\sqlexpress;Initial Catalog=SpatialData;Integrated Security=True"

                ///////////////////////////////////////////////////////////////////////////////////////////////////////////


                string where = null;

                if (query.Geometry != null)

                {

                    SqlGeography spatialFilter = Utility.CreateGeography(query.Geometry);

                    where = string.Format("({0}.STIntersects(geography::STGeomFromText('{1}',{2})) = 1)", query.GeometryColumnName, spatialFilter.ToString(), spatialFilter.STSrid.Value.ToString());

                }


                if ((where != null) && (!string.IsNullOrEmpty(query.Where)))

                   where += " AND ";


In the XAML page you have to set the name of the field containing geography (GeometryColumnName), the name of the table (Table) and the name of the service WFC (Service) for GeoDataLayer.


<samples:GeoDataLayer x:Name="GeoDataLayer" GeometryColumnName="GEOM"

                 Table="[SpatialData].[dbo].[LimitiComunali]" MaxRecordCount="10"

                                  Service="http://localhost:3088/ISpatialData.svc">


An option is adding a filter (Where), a max record count (MaxRecordCount) and a spatial filter (Geometry).
Since a map tip is created for every visualized feature, it is possible to point out the fields you want to visualize. If you do not point them out, all will be visualized.


<samples:GeoDataLayer.OutFields>

    <!--Empty for all fields-->

    <!--<sys:String>IdCameretta</sys:String>

                    <sys:String>NomeCameretta</sys:String>-->

  </samples:GeoDataLayer.OutFields>


Download here

venerdì 19 giugno 2009

ArcGIS API for Microsoft Silverlight /WPF Release Candidate

In attesa del Viewer per Silverlight (previsto in coincidenza con la UC americana) è stata rilasciata la release candidate (build 255 - giugno 2009).

Qui potete vedere l'elenco delle novità di questa release.

Tra le novità è stato aggiunto il RoutingTask per il supporto delle operazioni di routing fornite dai servizi di ArcGIS Server Network Analyst.

Qui potete vedere l'SDK in azione.

Esempio OpenStreetMap

lunedì 25 maggio 2009

Parse Json ArcGISOnline per Silverlight

In .NET Silverlight 2.0 abbiamo la classe WebClient che fornisce la più semplice classe per la comunicazione a servizi.
Per utilizzarla, si deve fornire il contenuto dell'Uri al quale si vuole accedere e poi chiamare il metodo DownloadStringAsync o il metodo OpenReadAsync per scaricare i dati.
Nel caso che vediamo, stiamo usando OpenReadAsync. Utilizzando questi metodi dobbiamo impostare una funzione di callback per prendere i dati restituiti. Quando il trasferimento dei dati è terminato, viene chiamata la nostra funzione client_OpenReadCompleted che riceve un oggetto (argomento: OpenReadCompletedEventArgs) che contiene una proprietà di nome Result che contiene l'oggetto restituito.
In questo esempio, facciamo una chiamata al locator EU degli ArcGIS Online con una risposta di tipo JSON.
Esempio di risposta:
{
"address" :
{
"Address" : "VIA LUCIANO MANARA 48",
"City" : "MONZA",
"Postcode" : "20052",
"Country" : "",
"Loc_name" : "ITASMRVATGeoco"
},
"location" :
{
"x" : 9.25588354543629,
"y" : 45.5901805291887,
"spatialReference" : {
"wkid" : 4326
}
}
}


Nello XAML utilizzeremo una nostra classe (JSONFormatter) che implementa IvalueConverter per il binding.

 
public partial class Page : UserControl
{
JsonObject results;
WebClient client;
public Page()
{
InitializeComponent();
// Send HTTP request to the JSON search API
client = new WebClient();
client.OpenReadCompleted += new OpenReadCompletedEventHandler(client_OpenReadCompleted);
}
private void MyMap_MouseClick(object sender, ESRI.ArcGIS.Map.MouseEventArgs e)
{
ESRI.ArcGIS.Geometry.MapPoint pt = e.MapPoint;
string xy = string.Format("{0},{1}", pt.X.ToString(NumberFormatInfo.InvariantInfo), pt.Y.ToString(NumberFormatInfo.InvariantInfo));
client.OpenReadAsync(new Uri("http://sampleserver1.arcgisonline.com/ArcGIS/rest/services/Locators/ESRI_Geocode_EU/GeocodeServer/reverseGeocode?location=" + xy + "&distance=0&f=pjson"));
Canvas.SetLeft(ResultsPane,e.ScreenPoint.X + 10);
Canvas.SetTop(ResultsPane,e.ScreenPoint.Y + 10);
GraphicsLayer graphicsLayer = MyMap.Layers["MyGraphicsLayer"] as GraphicsLayer;
Graphic graphic = new Graphic();
graphic.Symbol = DefaultMarkerSymbol;
graphic.Geometry = pt;
graphicsLayer.Graphics.Add(graphic);
}
void client_OpenReadCompleted(object sender, OpenReadCompletedEventArgs e)
{
if (e.Error == null)
{
// Parse results into a JsonObject
results = (JsonObject)JsonObject.Load(e.Result);
// Update LINQ query
UpdateQuery();
ResultsPane.Visibility = Visibility.Visible;
}
}
void UpdateQuery()
{
if (results != null)
{
// Generate LINQ query based on JsonObject and user settings
var members = from address in results
where address.Key == "address"
select address;
// Databind the results to a UI control
resultList.DataContext = members;
}
}
private void btnClose_Click(object sender, RoutedEventArgs e)
{
ResultsPane.Visibility = Visibility.Collapsed;
GraphicsLayer graphicsLayer = MyMap.Layers["MyGraphicsLayer"] as GraphicsLayer;
graphicsLayer.ClearGraphics();
}
}
public class JsonFormatter : IValueConverter
{
public object Convert(object value, Type targetType, object parameter, System.Globalization.CultureInfo culture)
{
string valueString = ((System.Collections.Generic.KeyValuePair<string,JsonValue>)value).Value[(string)parameter];
// JsonObject doesn't strip quotes from strings, so do that and return the result
return valueString.Replace("\"", "");
}
public object ConvertBack(object value, Type targetType, object parameter, System.Globalization.CultureInfo culture)
{
throw new NotImplementedException();
}
}


XAML:


<UserControl x:Class="slWSJson.Page"
    xmlns="http://schemas.microsoft.com/winfx/2006/xaml/presentation"
    xmlns:x="http://schemas.microsoft.com/winfx/2006/xaml"
    xmlns:esri="clr-namespace:ESRI.ArcGIS;assembly=ESRI.ArcGIS"
    xmlns:esriConverters="clr-namespace:ESRI.ArcGIS.ValueConverters;assembly=ESRI.ArcGIS"
    xmlns:esriSymbols="clr-namespace:ESRI.ArcGIS.Symbols;assembly=ESRI.ArcGIS"
    xmlns:local="clr-namespace:slWSJson">
  <UserControl.Resources>
    <local:JsonFormatter x:Key="jsonFormatter"/>
  </UserControl.Resources>
  <Grid x:Name="LayoutRoot" Background="White">
    <Grid.Resources>
      <esriSymbols:SimpleMarkerSymbol x:Name="DefaultMarkerSymbol"  Color="Red" Size="12" Style="Circle" />
    </Grid.Resources>
    <esri:Map x:Name="MyMap" Background="White" Extent="-7.732,35.69,27.021,56.346" MouseClick="MyMap_MouseClick">
      <esri:Map.Layers>
        <esri:ArcGISTiledMapServiceLayer ID="BaseMapLayer" Url="http://server.arcgisonline.com/ArcGIS/rest/services/ESRI_StreetMap_World_2D/MapServer" />
        <esri:GraphicsLayer ID="MyGraphicsLayer">
        </esri:GraphicsLayer>
      </esri:Map.Layers>
    </esri:Map>
    <Canvas>
      <StackPanel x:Name="ResultsPane" Visibility="Collapsed" Width="300" Height="150">
        <Button x:Name="btnClose"  Click="btnClose_Click" Content="Close">
        </Button>
        <ListBox x:Name="resultList"  ItemsSource="{Binding}" Height="150">
          <ListBox.ItemTemplate>
            <DataTemplate>
              <StackPanel>
                <TextBlock FontSize="18" TextWrapping="Wrap">
                  <TextBlock.Text>
                    <Binding Converter="{StaticResource jsonFormatter}" ConverterParameter="Address"></Binding>
                  </TextBlock.Text>
                </TextBlock>
                <TextBlock FontSize="14">
                  <TextBlock.Text>
                    <Binding Converter="{StaticResource jsonFormatter}" ConverterParameter="City"></Binding>
                  </TextBlock.Text>
                </TextBlock>
                <TextBlock FontSize="14">
                  <TextBlock.Text>
                    <Binding Converter="{StaticResource jsonFormatter}" ConverterParameter="Postcode"></Binding>
                  </TextBlock.Text>
                </TextBlock>
                <TextBlock FontSize="14">
                  <TextBlock.Text>
                    <Binding Converter="{StaticResource jsonFormatter}" ConverterParameter="Country"></Binding>
                  </TextBlock.Text>
                </TextBlock>
                <TextBlock FontSize="14">
                  <TextBlock.Text>
                    <Binding Converter="{StaticResource jsonFormatter}" ConverterParameter="Loc_name"></Binding>
                  </TextBlock.Text>
                </TextBlock>
              </StackPanel>
            </DataTemplate>
          </ListBox.ItemTemplate>
        </ListBox>
      </StackPanel>
    </Canvas>
  </Grid>
</UserControl>


Scarica qui la soluzione

mercoledì 11 febbraio 2009

ArcGIS API for Microsoft Silverlight

I 'guru' Art Haddad, Morten Nielsen, Rex Hansen presentano
Patterns and Best Practices for Building Applications with the ArcGIS API for Microsoft Silverlight: interessantissimo!!!


Preview:


Verrà rilasciata alla ESRI Developer Summit:
http://www.esri.com/news/releases/09_1qtr/silverlight.html

Vedi link per dettagli:
http://events.esri.com/bpc/2009/dev_agenda/index.cfm?fa=Session_Detail_Form&SessionId=136&ScheduleId=256


Silverlight API ArcGIS:
http://resources.esri.com/help/9.3/arcgisserver/apis/silverlight/help/index.html