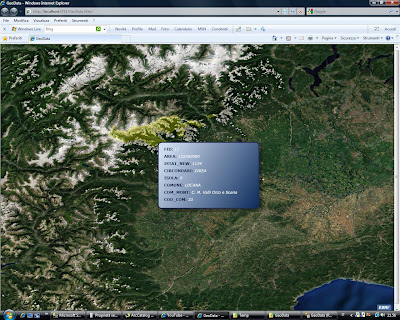
In WFC service, in the reference we use the WPF Silverlight ESRI API library containing the definition of geometry class which can be used with the same contract as far as the silverlight client part is concerned.
Calling the WFC Service from client silverlight allows you to catch objects (including geometry ESRI) to be visualized on the map.
With this code you can load points, lines and polygons but geography not valid data have not still been checked.
From sqlgeography to geometry ESRI:
public static Geometry CreateGeography(SqlGeography geometry)
{ string geometryType = geometry.STGeometryType().Value;if (string.Compare(geometryType, "Point") == 0)
return geometry.GetPointN(1);else if (string.Compare(geometryType, "MultiPoint") == 0)
{MultiPoint multipoint = new MultiPoint();
geometry.PopulatePointCollection(multipoint.Points);
return multipoint;}
else if ((string.Compare(geometryType, "Polygon") == 0) || (string.Compare(geometryType, "MultiPolygon") == 0))
{return geometry.BuildPoly<Polygon>((Polygon p, PointCollection t1) => p.Rings.Add(t1));
}
else if ((string.Compare(geometryType, "LineString") == 0) || (string.Compare(geometryType, "MultiLineString") == 0))
{return geometry.BuildPoly<Polyline>((Polyline p, PointCollection t1) => p.Paths.Add(t1));
}
return null;
}
In order to visualize your own data, in the WFC Service insert your connection string to database.
public System.Collections.Generic.List<Feature> GetSpatialData(Query query)
{ try { ///////////////////////////////////////////////////////////////////////////////////////////////////////////string connString = @"Data Source=PC-HOME\SQLEXPRESS;Initial Catalog=SpatialData;Integrated Security=True";
//For instance @"Data Source=MyServerName\sqlexpress;Initial Catalog=SpatialData;Integrated Security=True" ///////////////////////////////////////////////////////////////////////////////////////////////////////////string where = null;
if (query.Geometry != null)
{SqlGeography spatialFilter = Utility.CreateGeography(query.Geometry);
where = string.Format("({0}.STIntersects(geography::STGeomFromText('{1}',{2})) = 1)", query.GeometryColumnName, spatialFilter.ToString(), spatialFilter.STSrid.Value.ToString());
}
if ((where != null) && (!string.IsNullOrEmpty(query.Where)))
where += " AND ";In the XAML page you have to set the name of the field containing geography (GeometryColumnName), the name of the table (Table) and the name of the service WFC (Service) for GeoDataLayer.
<samples:GeoDataLayer x:Name="GeoDataLayer" GeometryColumnName="GEOM"
Table="[SpatialData].[dbo].[LimitiComunali]" MaxRecordCount="10"
Service="http://localhost:3088/ISpatialData.svc">
An option is adding a filter (Where), a max record count (MaxRecordCount) and a spatial filter (Geometry).
Since a map tip is created for every visualized feature, it is possible to point out the fields you want to visualize. If you do not point them out, all will be visualized.
<samples:GeoDataLayer.OutFields>
<!--Empty for all fields-->
<!--<sys:String>IdCameretta</sys:String>
<sys:String>NomeCameretta</sys:String>-->
</samples:GeoDataLayer.OutFields>

Download here


